
The real estate market in 2023 was a wild one—everyone wants to know what’s going to happen in 2024. In honor of my 10th year of real estate, I want to take a look at Rhode Island’s market trends for the past 10 years. So grab a cup of coffee, settle in, and get ready for some valuable insights! (note that if you’d rather watch this as a video–hop over to YouTube and enter my name, Jess Powers, into the search bar!
I became a licensed Realtor in 2014 and over these past ten years, I have seen significant changes in the real estate market. Instead of just wrapping up 2023, I want to share with you an in-depth look at the past decade of our local housing market here in Rhode Island–I’m going to give you the main highlights which will help you to understand the trends and inform you of where we’re headed over the next few years.
What metrics will we look at?
There are several key metrics that we’re going to discuss. All of the data/graphs/stats that I’m going to provide you come directly from Rhode Island Association of Realtors and the data that is available in MLS. There’s a lot of clickbait info out there, as well as strong yet misinformed opinions, so you really need to understand what data is being used and how it is framed. We will look at the median sale price, housing inventory, available homes for sale, number of homes that have sold, the absorption rate, supply and demand, interest rates, and inflation. To name a few!
Building my business in 2023
2023 was another successful year for me. As a solo agent I sold $22.3M in real estate in 2023 and helped 58 families buy or sell. I also started a micro team, that’s a local network within my brokerage of agents that I mentor and collaborate with. Between my ten years in the business, properties that I have renovated, investment properties that I rent out, real estate agents that I help mentor and train, and the significant number of successful transactions that I lead buyers and sellers through each year, I hope that you’ll see that the information and insight I bring comes from a solid base of understanding and practice. So let’s dive in:
Median Sale Prince of Single Family Homes
To start, let’s talk about the median sale price of homes in Rhode Island. I’m specifically going to use single family homes for this metric.; the median sale price is like finding the middle-ground price, showing you what most homes in an area are selling for, without getting thrown off by super expensive or dirt-cheap outliers. It’s a quick way to gauge typical property values in the market.
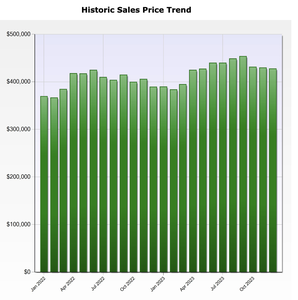
In 2023, Rhode Island’s real estate market continued to showcase a steady increase year over year. This graph shows the increase from 2022-2023.
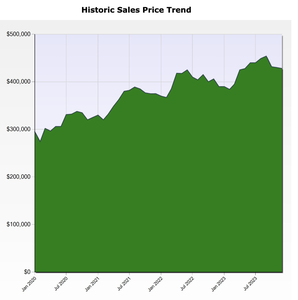
Let’s take a wider look at 2020 to 2023
Now let’s step back to look at the market when I started in 2014
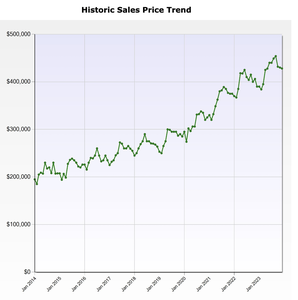
What stands out to you?
Well first you can see that there’s an upwards trend–the price is increasing. But you also notice that it’s not a straight line–there are ups and downs, even during the year. So let’s focus back in–I want you to look at data in my spreadsheet.
First let’s go back to what we saw this year
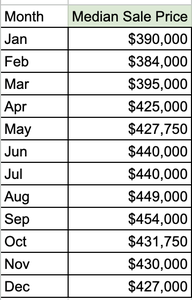
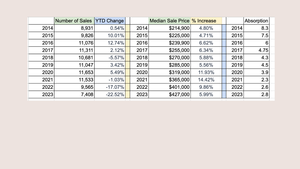
Overall in 2023 we saw home prices increase 5.99% year to date and overall the median sale price for the year increased to $425k. But we also look at each month–it’s typical to have changes month to month, some of that is seasonality–more sellers tend to sell during the warmer months of the year and there’s typically less activity at the end of the year during the holidays.
Let’s look at a side by side of 2023 & 2022 in the next image
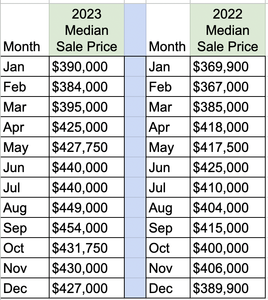
We usually see fluctuations throughout the year. That’s important for buyers and sellers to be aware of—there may be more advantageous times to list a property for sale and there also may be more advantageous times of the year to buy a home. You should rely on a real estate agent to help you to evaluate your options and explore opportunities that you may have not considered.
Let’s go back to that 10 year view of the median sale price
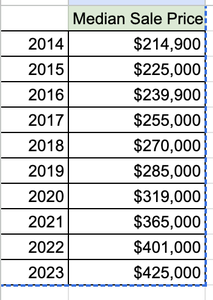
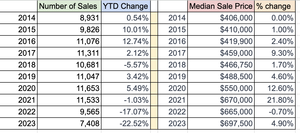
Ok, the median sale price was $214k. Check out the year over year growth that we’ve experienced. If you’ve owned your home since 2014 then your home value is likely double what it was ten years ago—now of course we said this is a median sale price metric so it’s going to vary one way or another depending upon what City you’re in.
The median sale price in Barrington for example was $398k in 2014 and it’s now at $710k–that’s about an 82% increase. East Greenwich median sale price in 2014 was $406k and ended 2023 at $697k. It’s important to look at the big picture but when it comes to buying or selling you really want to also dive into the very specific localized market.
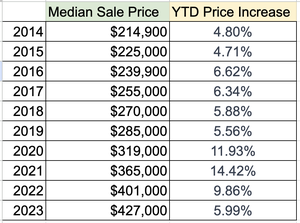
Home prices have gone up & significantly during the years of 2020, 2021, and 2022. It’s important to note that we’re back to what we’d consider slightly above more normal growth. If we had price increases of 9, 10, & 11% each year we’d really be in a situation of unhealthy and unrealistic price increases.
Check out this fun map of the US
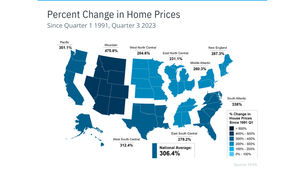
This shows the % change of home prices since 1991!! The North East region price appreciation is around 287%. The national average is 306%
Let’s go back to one more slide regarding home prices. I’d like to quickly show you a graph from the National Association of Realtors that highlights year-to-date price increases by region.
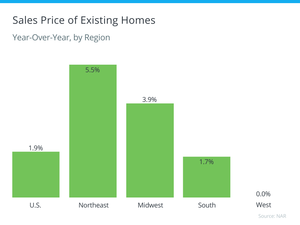
The key takeaway here is that different regions exhibit distinct behaviors. While there are overarching trends that can guide our projections, localized or regional influences can vary significantly.
For instance, inventory levels differ between the Northeast region and other areas, especially here in Rhode Island–as I mentioned in my 3rd quarter market update, Rhode Island lags behind in new home construction due to limited space and infrastructure, unlike places like Utah–we have a lack of available homes for sale with no real plan in place to solve that shortage. There are a lot of factors at play and each region has different variables.
The number of available homes for sale, aka Inventory, has a major impact on home prices, so let’s look at how that has changed over the past 10 years.
Inventory shortages have been a defining characteristic. The next graph I want to show you tells the story of decreasing inventory, which has created an extremely competitive landscape for buyers. Remember when we talked about the median sale price and how it fluctuates throughout the year—that’s in relation to the number of Active listings and the buyer demand. So you can see that when we look at the past 10 years there were a lot more listings available!
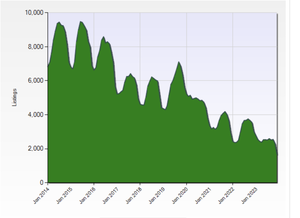
Here, it’s easier to look at the difference between where we were in 2014 and what the market looked like in 2023.
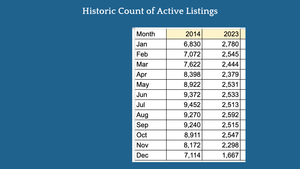
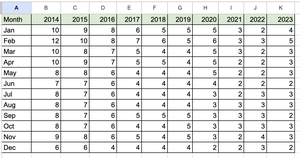
Yikes! 1600 single family homes available for sale in December. Let’s take another birds-eye view of the past 10 years
Start at the top of each column and move down—you’ll see that we just don’t have a lot of homes that are available for sale.
That can make your eyes cross–I get it, I stare and spreadsheets and compare data on a regular basis. I have to so that I can distill this info down for my clients–how else are you going to make informed decisions?
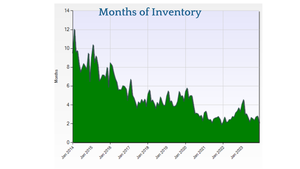
I’m not done with Inventory even though I’m certain that you get the point that it has been significantly declining over the past ten years. One of the other ways that we help buyers and sellers gauge supply and demand dynamics is by the months of inventory, often referred to as the absorption rate. This represents how many months it would take to sell all available homes at the current sales pace.
Here’s a graph that shows the decline. Again, you see those fluctuations throughout the year but overall the trend shows the decrease in available supply.
A six month supply of inventory offers a balanced market.
Lower than six and your in a market that is more favorable to sellers—supply and demand! That’s what we’ve seen. When I started in 2014 we were still recovering from the market crash that started in 2008–there were a lot more properties available and demand wasn’t as strong.
In 2014, with levels above the 6 months absorption rate, the list price was as close to what the seller’s agent thought they might be able to get, knowing that there may be some negotiating needed. It wasn’t as common to receive multiple offers and it took longer to sell a home–buyers could take their time and go back to view a home several times before making a decision. But as our inventory has trended downwards and more buyers have entered the buying pool—supply and demand! So we’ve been in a situation, especially in the last three years where we’ve got low inventory plus high interest rates. But before we jump to interest rates I have one more slide to show you.
Existing Home Sales are down 15% in the North East
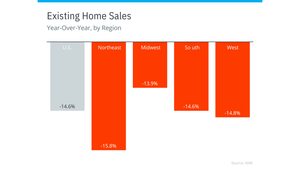
Imagine if you saw this slide and you didn’t have any of the context from what I’ve been showing you. You might say–”Wow! Home sales are down more than 15% in the North East.” And that might lead you to think that it’s an indication that people aren’t buying homes which must mean that prices are down–or that they will be going down. Right? So if you saw this and you were a buyer you might say—ok great, I’m going to wait for prices in my area to go down because that must be what’s happening.
That’s not actually what this data is telling us. Sorry.
Let’s go back to this spreadsheet with the number of active listings—again, you can see that over the past ten years we just don’t have as many listings. And some are going to sell and some aren’t.
If you have less inventory to begin with then you’re also going to have less sales.
Bear with me! I know this is a lot of information but I need you to understand this so that you can help spread the word!
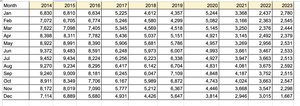
Let’s go back and look at the number of homes sold–again, for the sake of the data I’ve been referring to single family homes but condos and multifamily properties follow a similar trend. Let’s look again closely at the number of homes sold. I’ve seen some fluctuations–there was an increased number of homes being sold consistently until the past two years. Take a look at this year–22.5% decrease in the number of homes being sold. That’s higher than that stat for the region of 15%! But before we jump to any conclusions let’s look at the other data points.
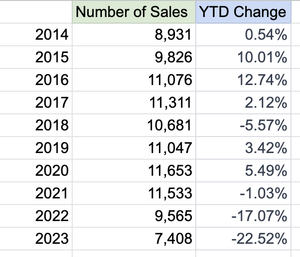
You have to look at the whole picture–that means the number of Active listings, and reference that with the number of homes that sold, as well as the absorption rate because that’s a key indicator of demand.
There are a few metrics such as the average days on market that also help us to understand the demand.
All of this paints a picture to help us to see why prices have continued to go up and the number of sales to go down. So that 22.5% decline in sales is a product of reduced availability and high demand.
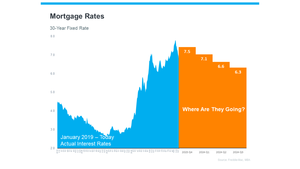
Now let’s address interest rates. In 2014 top-tier credit borrowers could secure a mortgage around 3.75%. I secured an FHA loan for a two family property that I lived in at 3.25% in 2015 Rates fluctuated a bit and went up in 2018–I remember I bought an investment property and my rate was 5.45% and I was mad about it. In fact, I refinanced that property in 2021 at 3.125%.
We had a lot of years with historically low rates–that’s part of what kept demand so high. And then the Fed’s further stepped in, buying up mortgage backed securities like they were going out of style during the pandemic plus handing out a lot of money—it’s no wonder prices went up so significantly during that three year period. But in 2022–with inflation catching up to us–the fun ended and the Feds went through a series of rate hikes.
I will point out that people have been screaming from their soapboxes that the market was going to crash–at multiple times over the past 10 years. 2017, 2019, 2020, 2022, 2023…2024…. Guess what–it didn’t and I don’t see it happening.
People have to move–about 10% of the US population moves each year. And Millennials are tired of renting, they make up a significant part of the first time buyer pool right now. Speaking of renting—have you looked at the average rental in Providence lately? It’s now around $2200 per month.
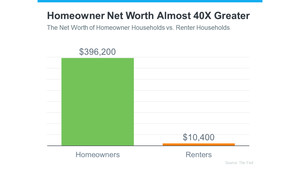
The fact is that homeownership still provides people a path to financial health–especially in comparison to renters. Now this isn’t to shame renters—my basement flooded last night at 4am and I was wishing I wasn’t the landlord. Homeownership is expensive and it’s not right for everyone. That said–overwhelmingly the data shows that homeowners have significantly more net worth than renters.
So let’s go back to Interest rates
Rates peaked in October around 8%. I felt it–several of my buyers took a pause. Some buyers stuck it out & with reduced competition actually got more favorable terms than they otherwise would have. I found a few local programs through other lenders for first time home buyers that offered reduced interest rates—that was a major win for those clients!
Enter 2024—-rates took a pretty considerable dive! Glory be! It’s projected that they’ll hover around the 6.3% average for the year. And while I don’t have a crystal ball to predict where interest rates will be I don’t NEED a crystal ball to be able to project what to expect in 2024.
Here are the industry expert projections for home price appreciation over the next 5 years.
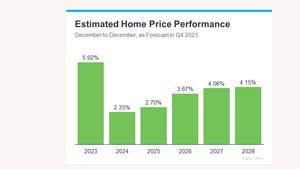
Note that this is overall for the US and here in Rhode Island we typically are in the upper tiers.
Here it is, my market projection—
and I’m pretty sure that I’ve given you enough data that you will come to the same conclusion.
Inventory will remain low—we may have more homeowners that are willing to sell this year but at the same time it’s likely that many of them will also need to buy.
Home prices will continue to appreciate—likely around 6-8% year over year; consistent with what we saw this year. Some are projecting higher, some are projecting lower. I remain in the middle and will give it a 7%.
I think rates will stay where they are–hovering in the mid 6% range. Unless the Feds start buying mortgage backed securities again in which case they could go lower. I don’t think that would be a positive thing for buyers though. While you may save a few hundred bucks a month if rates drop to the 5% range I think we’ll see demand that was similar to 2021–that will push that year over year appreciation from my projection of 7% closer to the 14% range—that means you’ll pay a lot more for that home. So many people would re-enter the market.
That’s a wrap for 2023 review and 2024 market projection. Agree? Disagree? I’d love to hear from you!