
If you’re contemplating a move, staying abreast of the current housing market is paramount. Here’s an update on the market activity that I’m seeing right now, specifically the number of homes that are available for sale—a crucial factor whether you’re in the market to buy or sell.
In the realm of real estate, there exists a recurring pattern known as seasonality. Spring, the zenith of home buying, witnesses a surge in new listings. Conversely, the latter half of the year tends to witness a tapering off as the pace of sales moderates. You can look back at historic real estate data and see this seasonal trend. Understanding seasonal trends in relation to the current housing market data will help to inform you as to what’s happening in your local market.
The graph below, drawing from Realtor.com data, illustrates this seasonality and the intriguing departure from the norm this year:
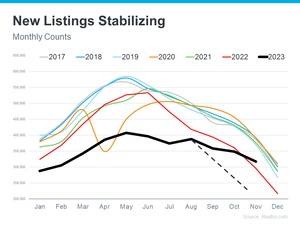
Examining this graph, several noteworthy observations emerge:
- The years 2017-2019 (blue and gray lines) conform to the standard seasonal trends.
- 2020 (orange line) disrupted this pattern, attributed to the pandemic-induced pause in seller plans.
- 2021 (green line) and 2022 (red line) attempted to regain normalcy but presented unique deviations.
Enter 2023 (black line), deviating significantly from the typical trajectory. Rather than the anticipated decline in new listings, there’s a stabilization, with more properties entering the market compared to the same period last year.
What Does This Mean for You?
For potential buyers, this stabilization signals a positive development. A consistent influx of new listings means that you have more choices! There’s also less buyer competition right now so that may mean that you have more leverage to include contingencies in your offer that are more favorable terms as well as opportunities for some seller concessions such as price reductions or repairs following inspections.
For sellers, despite the departure from seasonal norms, inventory remains below pre-pandemic levels. If you look again at the graph, you’ll see the black line for this year is still lower than normal, meaning inventory isn’t going up dramatically and prices aren’t heading for a crash. With less competition, your property stands a better chance of capturing attention and attracting eager buyers. That said, you really need to understand the seasonal fluctuations so that you can decide the best timing to sell your home.
The Bottom Line:
Whether you’re just getting started on the home-buying journey or contemplating a sale, you need to understand the dynamics affecting the current market–and that information fluctuates depending upon where you are located. Make sure you have a trusted expert that can give you detailed insight that is relevant to your specific local market so that you can make well informed decisions!